1 Overview
The Rubin Plot Navigator is a web front-end for browsing plots stored in a Butler repository. These plots are typically generated by analysis_drp or analysis_tools, but any other pipeline that stores plots in a Butler repo would work equally well. The plots are currently stored as individual PNGs, with a different dataset type for each different plot and a common storage class. The DataIDs of the plots are typically the same as those of the data that went into generating the plots. New dataset types are automatically detected and displayed in the navigator based on their storage class.
1.1 Screenshots
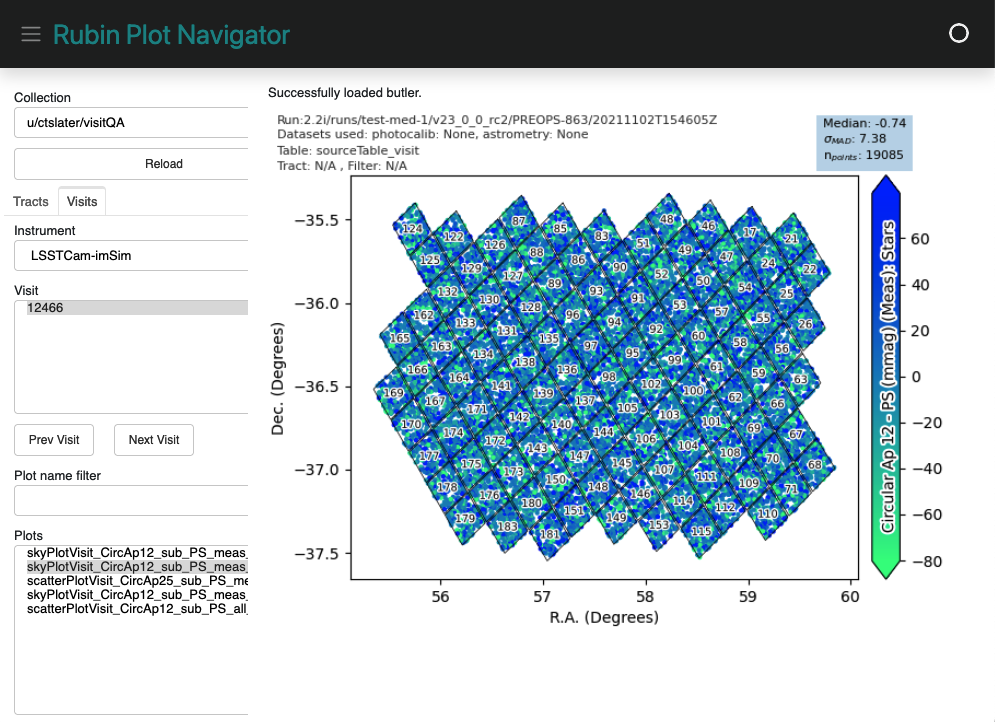
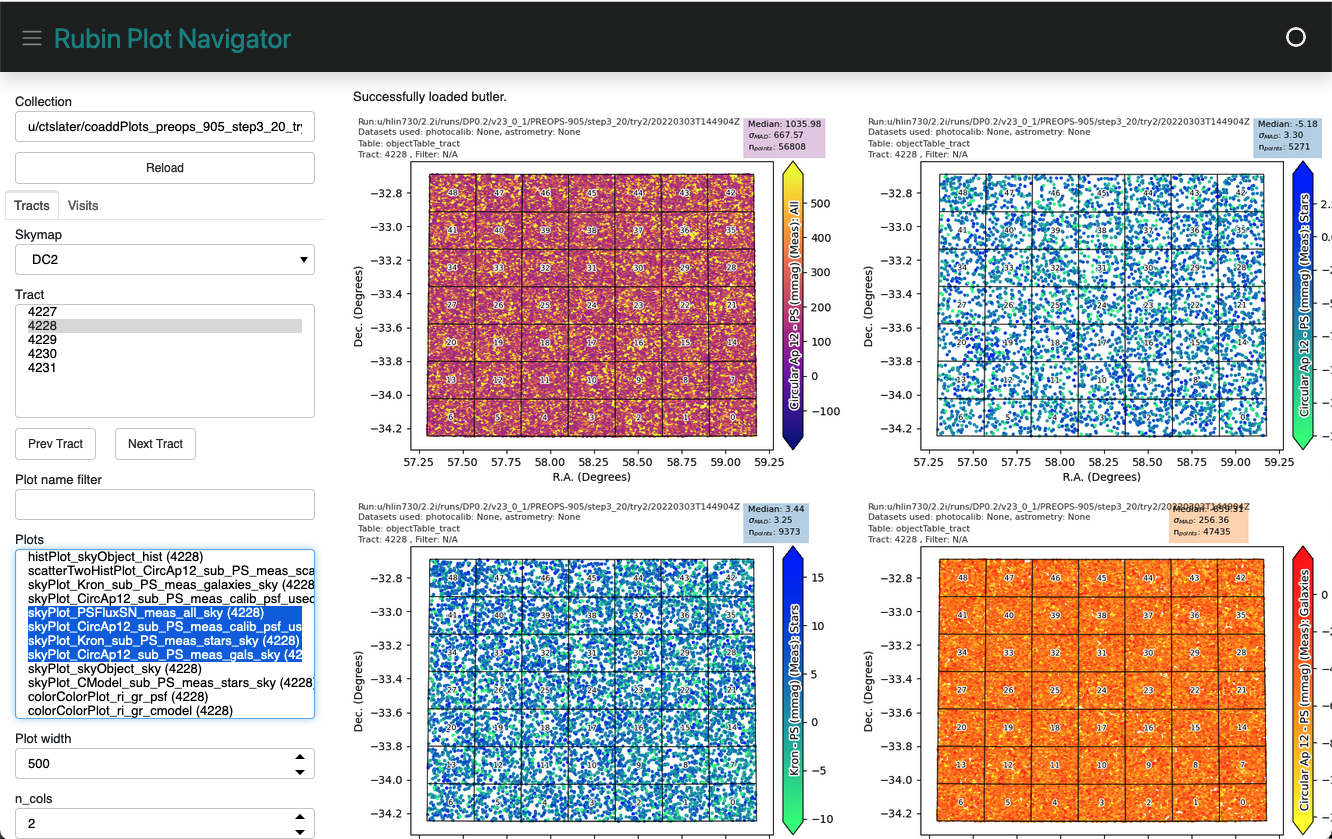
2 Implementation
The user interface is based on Panel. This enables the entire navigator to be written in python and the library handles all of the HTML and Javascript necessary for interactivity. It may be necessary in the future to port the navigator to Javascript to gain better control over the UI interactions.
The navigator is deployed via phalanx, and can be enabled on any phalanx site where a butler repo is available. On sites where it is enabled, it is available at /plot-navigator. A plot-navigator instance can only serve data from a single Butler repo; there is not currently any functionality to allow users to select between multiple available repos.
3 Future Steps
The dataset-per-plot and dataset-type-per-plot-type model is adequate for moderate numbers of plots, but inefficient at larger scales. It is likely that we will need to generate many output plots per input dataset (i.e. a single SourceTable dataset contains the outputs from many different measurement algorithms, and we will want different plots that cover most of these algorithms), and so storing those plots in a single dataset would reduce the proliferation of new dataset types.
A prior version of the navigator included an interface for comparing the same plot between two different collections (e.g. an older processing and a newer processing). In the current code structure this was difficult to maintain and required special casing in many places, and was removed during a refactor. The functionality is valuable though and should be added back.
Currently there is no way to link to specific plots or specific combinations of selections in the UI. Adding that would be extremely useful for sharing plots, but may stretch the capabilities of the Panel UI. It would also be useful to have “unfurls” for slack, though that might require some effort to handle authentication.